The COSY 90 pulse sequence (COSY stand for COrrelated SpectroscopY)
The example under study is the saccharose (Fig 29).
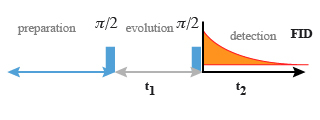
The aim of this sequence is to correlate signals of identical nuclei with a scalar coupling. For an isolated nucleus, it is made of two
 impulsions on both side of the evolution period t1 (Fig. 13).
The preparation begins with a relaxation delay allowing the magnetization to come back to its equilibrium, then the period t1 occurs with a stepwise increase and finally the t2 period is the acquisition time[1].
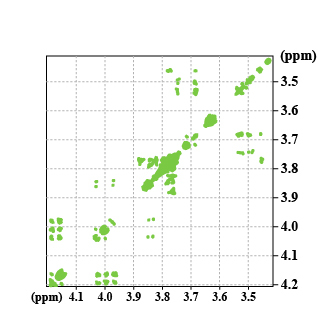
Following the double Fourier transform, we get a spectrum in chemical shift on the two axis. Moreover, the cross peaks indicate the nuclei which are coupled within each other and allow then a direct attribution of the neighbouring protons.
We can understand the obtention of the diagonal and crossing signals of the COSY spectrum by the merely means of quantitative consideration[1].
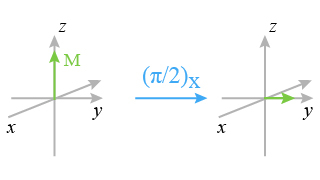
In fact, if we consider a singlet signal without scalar spin-spin coupling, the preparation allows to set the maximal amount of nuclei at their right position and the first impulsion
 generates a transverse magnetization M(A) which rotates around the Y axis (Fig. 14).
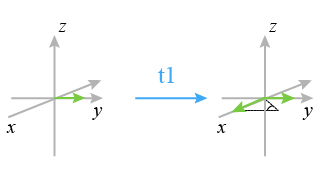
During the evolution period, the aimantation M(A) precesses with the frequency of the corresponding nucleus resonance
 in the rotating frame; there is thus a sharing of the spins between the x axis and the y axis (Fig. 15).
The components Mx and My of the transverse magnetization at the end of the evolution period in the Ox and Oy axis of the rotating frame are then :

 Where
Where
 is the aimantation contribution before the execution of the first impulsion and
 the apparent transverse relaxation time of the corresponding nucleus.
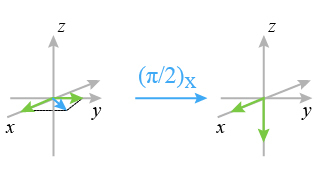
The second impulsion
allows to rotate the y component which stays in the xy plane, in the negative z part direction (-z).
These last one will not be detected (Fig. 16). However, the x part, still in the xy plane will be taken into account.
The magnetization which is going to be detected is of the form :
 , where as the magnetization along the –z axis followed the formula:
 .
.
The intensity of the signal to be recorded depends thus of the time dependent position of the M(A) vector at the very time of the end of the evolution period. This intensity is determined by the Larmor frequency of the A nucleus. The amplitude is modulated in t1 versus this frequency and the Fourier transform yields in both dimensions the frequency
 and then a diagonal signal.In the case of a spin-spin coupling, the second impulsion
induce a change in the transverse A magnetization, but also changes of populations for other transitions in the spin system under study.
and then a diagonal signal.In the case of a spin-spin coupling, the second impulsion
induce a change in the transverse A magnetization, but also changes of populations for other transitions in the spin system under study.
Therefore, an exchange of magnetization occurs between all the nuclei which are coupled between each other. Their signals, in a set of experiments
 , are in the same way modulated versus the neighbouring nuclei. This ends up with cross peaks of the 2D spectrum in
 and
and
 and allows us to get a spectrum in which the homonuclear scalar coupling constants are figure out by spots outside of the diagonal.
For example, we might see the coupling between the f3 and f4 protons at the crossing of 4.05 and 4.18 ppm (Spectrum 3).